
Forecasting#
This gallery focuses on forecast construction, forecast-reading, and forecast-interpretation workflows in GeoPrior.
Unlike the API reference, the pages collected here are organized around the practical question:
How should a user build, inspect, compare, and evaluate forecast outputs once Stage-4 inference has produced raw model predictions?
The emphasis is therefore on understanding forecast structure and forecast usefulness. These examples show how GeoPrior turns raw model outputs into readable forecast artifacts such as:
formatted evaluation and future forecast tables,
forecast metric summaries,
sample-wise forecast trajectories,
future quantile maps,
holdout-versus-future comparisons,
and horizon-by-horizon forecast diagnostics.
In other words, this gallery is about working with the forecast: not only plotting it, but also understanding where the forecast tables come from and how they should be evaluated.
What this gallery teaches#
Most pages in this section follow the same broad pattern:
create a compact synthetic forecast or model-output example,
call the real GeoPrior utility or plotting function,
inspect the returned table, metrics, or forecast view,
explain how to read and interpret the result.
Even when a page prints small summaries or simple metric tables, the main goal remains the same: to explain the forecast artifact and its interpretation.
Module guide#
Module |
Main output |
Purpose |
|---|---|---|
|
Forecast tables |
Convert raw model outputs into canonical evaluation and future forecast DataFrames that downstream plotting and evaluation helpers can use directly. |
|
Forecast metric summaries |
Evaluate an evaluation forecast table using deterministic metrics, interval quality summaries, and optional horizon-wise diagnostics. |
|
Forecast quick-look view |
Plot sample-wise forecast trajectories and compact quick-look comparisons from a long-format forecast table. |
|
Future quantile map grid |
Plot year-by-year future forecast maps and compare lower, median, and upper forecast scenarios spatially. |
|
Holdout-versus-future comparison |
Compare evaluation-period actual-versus-predicted structure before interpreting future forecast scenarios. |
|
Horizon-step forecast grid |
Plot forecast outputs row-by-row by forecast step to inspect how the spatial or predicted field changes across the horizon. |
Reading path#
A useful way to move through this gallery is to follow the logic of a complete forecast workflow:
begin by formatting raw model outputs into forecast tables,
evaluate those tables to establish basic forecast quality,
inspect a compact quick-look of forecast trajectories,
continue to future quantile maps,
compare holdout structure with future projections,
finish with horizon-by-horizon diagnostics.
That is why the examples are grouped by forecast workflow purpose rather than only by plotting function.
Gallery organization#
Forecast table construction#
These examples are the best place to start when you want to understand how raw model outputs become the standard forecast tables used across the forecasting workflow.
They focus on questions such as:
what the raw prediction tensors look like,
how quantile forecasts are unpacked,
how coordinates and time labels are attached,
and how
df_evalanddf_futureare constructed.
The main page in this group is:
format_and_forecast.py
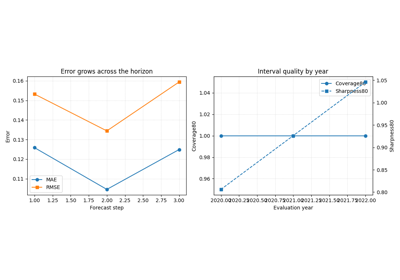
Forecast evaluation#
These examples focus on turning an evaluation forecast table into quantitative diagnostics.
They are most useful when you want to inspect:
how accurate the median forecast is,
how interval coverage and sharpness behave,
whether accuracy degrades across the horizon,
and how forecast quality changes across evaluation times.
The main page in this group is:
evaluate_forecast.py
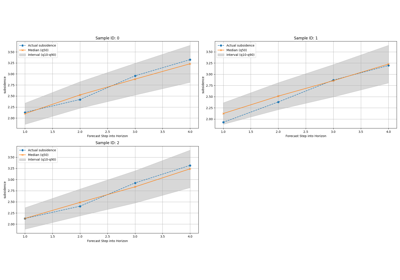
Quick-look forecast inspection#
These examples are the best place to continue once a forecast table already exists.
They focus on questions such as:
how one sample evolves through the horizon,
whether predictive intervals widen with lead time,
and whether quick visual comparisons already suggest plausible forecast behavior.
The main page in this group is:
plot_forecasts.py
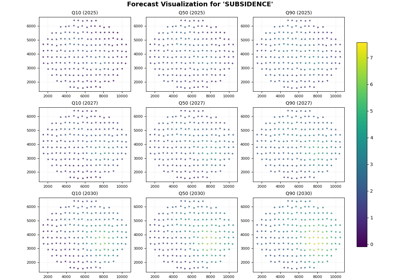
Future forecast maps#
These examples focus on the spatial interpretation of future forecasts.
They are most useful when you want to inspect:
how the forecast field changes from one year to the next,
where the main hotspots are located,
and how lower, median, and upper scenarios differ spatially.
The main page in this group is:
plot_future_quantiles_map.py
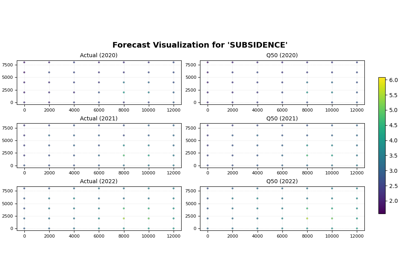
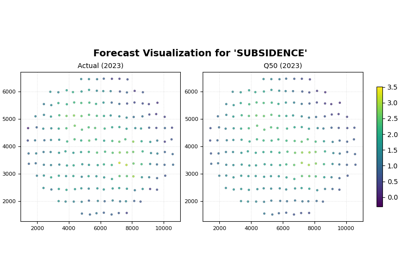
Evaluation-versus-future comparison#
These examples focus on the scientific habit of separating:
what can still be checked against observed values, and
what belongs to future scenario interpretation.
They are especially useful when the goal is not only to show future maps, but also to justify why those maps deserve interpretation.
The main page in this group is:
plot_holdout_vs_forecast.py
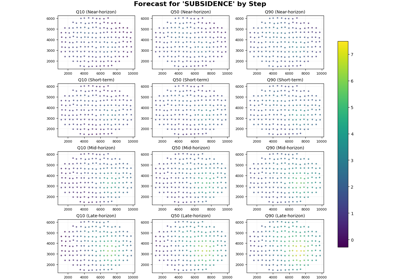
Horizon-wise forecast diagnostics#
These examples focus on forecast behavior step by step.
They are particularly useful when you want to inspect:
whether later steps intensify smoothly,
whether uncertainty widens across the horizon,
whether hotspots persist or expand from one step to the next,
and whether a deterministic or near-deterministic forecast remains coherent through lead time.
The main page in this group is:
plot_forecast_by_step.py
Why this separation matters#
This gallery deliberately keeps four concerns distinct:
forecast construction,
forecast evaluation,
forecast visualization,
forecast interpretation.
That separation makes the workflow easier to understand. It also helps users distinguish between:
utilities that build forecast tables from raw model outputs,
helpers that score those forecast tables,
plotting functions that turn those tables into readable views,
and lesson pages that explain what those artifacts actually mean.
Notes#
These examples are intentionally compact and lesson-oriented.
The pages in this section are forecast-first: they may print small summaries or metric tables, but their main purpose is to explain how forecast outputs should be constructed, read, and evaluated.
A useful rule of thumb is:
forecasting/explains how forecast outputs are built, read, and evaluated,uncertainty/explains calibration and reliability,diagnostics/explains workflow and training diagnostics,tables_and_summaries/builds reusable analysis artifacts.
A strong practical reading sequence is:
first format the forecast tables,
then evaluate the forecast quality,
then inspect the forecast quickly,
then read future quantile maps,
then validate against holdout structure,
then study horizon-wise behavior in more detail.
Forecast by horizon step with plot_forecast_by_step
From raw model outputs to forecast tables with format_and_forecast
Holdout versus future forecast with plot_eval_future