
Note
Go to the end to download the full example code.
Enrich main datasets with surface elevation#
This lesson teaches how to use GeoPrior’s
add-zsurf-from-coords build command.
Unlike the earlier spatial-sampling pages, this command does not choose or rearrange rows. Instead, it enriches an existing main analysis table with:
z_surf: surface elevation looked up from coordinates,optional
head_m: hydraulic head computed as surface elevation minus depth below ground surface,and a small diagnostic summary describing merge quality.
Why this matters#
Many hydrogeological and subsidence workflows keep surface elevation in a separate coordinate lookup table. Before modelling or exporting harmonized artifacts, it is often useful to merge that lookup into the main tabular dataset.
This builder performs that job in a transparent way:
it rounds longitude/latitude before merging,
reduces duplicate lookup rows with a chosen reducer,
optionally computes hydraulic head,
and writes one enriched CSV per city plus an optional JSON summary.
Imports#
We call the real production CLI entrypoint from the package. For the synthetic inputs, we reuse the shared spatial-support helpers so the lesson looks like a compact city rather than a hand-made rectangular toy grid.
from __future__ import annotations

import json
import tempfile
from pathlib import Path

import matplotlib.pyplot as plt
import numpy as np
import pandas as pd

from geoprior.cli.build_add_zsurf_from_coords import (
    build_add_zsurf_main,
)
from geoprior.scripts import utils as script_utils
Step 1 - Build compact synthetic inputs for two cities#
The command expects, for each city:
one main dataset with longitude/latitude columns,
one elevation lookup dataset with the same coordinates and an elevation column.
We build both from the same synthetic support so the merge remains realistic and reproducible.
We also make two details visible on purpose:
the main table coordinates are slightly perturbed, so the lesson shows why the command rounds coordinates before merging;
the lookup table contains duplicate coordinates, so the lesson shows why the
--reduceroption matters.
rng = np.random.default_rng(44)


def _rescale(
    values: np.ndarray,
    lo: float,
    hi: float,
) -> np.ndarray:
    """Rescale an array to a closed interval."""
    arr = np.asarray(values, dtype=float)
    amin = float(np.nanmin(arr))
    amax = float(np.nanmax(arr))
    if amax <= amin:
        return np.full_like(arr, fill_value=lo, dtype=float)
    t = (arr - amin) / (amax - amin)
    return lo + (hi - lo) * t


def _make_city_inputs(
    *,
    city: str,
    center_x: float,
    center_y: float,
    span_x: float,
    span_y: float,
    nx: int,
    ny: int,
    footprint: str,
    seed: int,
    lon0: float,
    lat0: float,
    lon_span: float,
    lat_span: float,
    sample_n: int,
    missing_lookup_n: int,
) -> tuple[pd.DataFrame, pd.DataFrame]:
    """Build one main table and one elevation lookup table."""
    support = script_utils.make_spatial_support(
        script_utils.SpatialSupportSpec(
            city=city,
            center_x=center_x,
            center_y=center_y,
            span_x=span_x,
            span_y=span_y,
            nx=nx,
            ny=ny,
            jitter_x=18.0,
            jitter_y=14.0,
            footprint=footprint,
            seed=seed,
        )
    )

    # Convert the synthetic support to geographic-looking
    # coordinates. We keep higher precision here so that
    # ``--round-decimals`` later becomes meaningful.
    lon = lon0 + lon_span * support.x_norm
    lat = lat0 + lat_span * support.y_norm

    # Create a smooth elevation surface and a depth-bgs field from
    # shared spatial generators.
    raw_elev = script_utils.make_spatial_field(
        support,
        amplitude=2.4,
        drift_x=0.85,
        drift_y=0.55,
        phase=0.30,
        local_weight=0.16,
    )
    raw_depth = script_utils.make_spatial_field(
        support,
        amplitude=1.6,
        drift_x=-0.30,
        drift_y=0.40,
        phase=1.10,
        local_weight=0.12,
    )

    elevation = _rescale(raw_elev, 18.0, 74.0)
    gwl_depth = _rescale(raw_depth, 1.8, 12.5)

    lookup_base = pd.DataFrame(
        {
            "longitude": lon,
            "latitude": lat,
            "elevation": elevation,
        }
    )

    # Duplicate a few lookup rows and perturb only elevation so the
    # command must reduce duplicate coordinate rows with ``mean``.
    dup = lookup_base.sample(
        n=18,
        random_state=seed,
        replace=False,
    ).copy()
    dup["elevation"] = dup["elevation"] + rng.normal(
        0.9,
        0.25,
        size=len(dup),
    )

    lookup = pd.concat(
        [lookup_base, dup],
        ignore_index=True,
    )

    # Build the main table from a subset of lookup locations.
    picked = lookup_base.sample(
        n=sample_n,
        random_state=seed + 100,
        replace=False,
    ).reset_index(drop=True)

    # Slight coordinate perturbations. After rounding to 4 decimals,
    # these still align with the lookup grid.
    picked["longitude"] = picked["longitude"] + rng.normal(
        0.0,
        2.0e-05,
        size=len(picked),
    )
    picked["latitude"] = picked["latitude"] + rng.normal(
        0.0,
        2.0e-05,
        size=len(picked),
    )

    # Remove a few rounded lookup coordinates so the lesson also
    # shows missing z_surf rows in the diagnostics.
    miss_keys = (
        picked.loc[: missing_lookup_n - 1, ["longitude", "latitude"]]
        .round(4)
        .drop_duplicates()
    )
    miss_keys["_drop"] = 1

    lookup = lookup.copy()
    lookup["longitude"] = pd.to_numeric(
        lookup["longitude"],
        errors="coerce",
    )
    lookup["latitude"] = pd.to_numeric(
        lookup["latitude"],
        errors="coerce",
    )
    lookup["_lon4"] = lookup["longitude"].round(4)
    lookup["_lat4"] = lookup["latitude"].round(4)

    lookup = lookup.merge(
        miss_keys.rename(
            columns={
                "longitude": "_lon4",
                "latitude": "_lat4",
            }
        ),
        on=["_lon4", "_lat4"],
        how="left",
    )
    lookup = lookup.loc[lookup["_drop"].isna()].copy()
    lookup = lookup.drop(
        columns=["_lon4", "_lat4", "_drop"]
    )

    # Attach a few realistic main-table fields.
    sample_idx = np.arange(len(picked), dtype=int)
    rainfall = _rescale(raw_elev[: len(picked)], 1050.0, 1880.0)
    subsidence = _rescale(raw_depth[: len(picked)], 2.5, 16.0)

    main = pd.DataFrame(
        {
            "sample_idx": sample_idx,
            "city": city,
            "year": 2024,
            "longitude": picked["longitude"].to_numpy(float),
            "latitude": picked["latitude"].to_numpy(float),
            "GWL_depth_bgs": gwl_depth[
                picked.index.to_numpy(int)
            ],
            "rainfall_mm": rainfall,
            "subsidence_mm": subsidence,
        }
    )

    return main, lookup


ns_main, ns_lookup = _make_city_inputs(
    city="Nansha",
    center_x=5_600.0,
    center_y=3_850.0,
    span_x=5_200.0,
    span_y=3_500.0,
    nx=25,
    ny=18,
    footprint="nansha_like",
    seed=31,
    lon0=113.37,
    lat0=22.63,
    lon_span=0.33,
    lat_span=0.19,
    sample_n=180,
    missing_lookup_n=8,
)

zh_main, zh_lookup = _make_city_inputs(
    city="Zhongshan",
    center_x=4_900.0,
    center_y=3_200.0,
    span_x=4_800.0,
    span_y=3_300.0,
    nx=24,
    ny=17,
    footprint="zhongshan_like",
    seed=57,
    lon0=113.18,
    lat0=22.32,
    lon_span=0.37,
    lat_span=0.24,
    sample_n=165,
    missing_lookup_n=6,
)

print("Synthetic input previews")
print("------------------------")
print("Nansha main rows   :", len(ns_main))
print("Nansha lookup rows :", len(ns_lookup))
print("Zhongshan main rows:", len(zh_main))
print("Zhongshan lookup rows:", len(zh_lookup))

print("")
print("Nansha main preview")
print(ns_main.head(6).to_string(index=False))

print("")
print("Nansha lookup preview")
print(ns_lookup.head(6).to_string(index=False))
Synthetic input previews
------------------------
Nansha main rows   : 180
Nansha lookup rows : 220
Zhongshan main rows: 165
Zhongshan lookup rows: 189

Nansha main preview
 sample_idx   city  year  longitude  latitude  GWL_depth_bgs  rainfall_mm  subsidence_mm
          0 Nansha  2024   113.6165   22.7201         4.5747    1169.9780         5.7538
          1 Nansha  2024   113.5623   22.6865         4.3151    1166.6345         5.4182
          2 Nansha  2024   113.4675   22.7642         4.1043    1162.8755         5.1457
          3 Nansha  2024   113.5344   22.6863         3.9002    1158.5118         4.8818
          4 Nansha  2024   113.4811   22.7856         3.8049    1159.1381         4.7586
          5 Nansha  2024   113.6713   22.7310         3.8367    1168.3529         4.7997

Nansha lookup preview
 longitude  latitude  elevation
  113.4668   22.6643    26.0949
  113.4809   22.6640    25.8693
  113.4943   22.6643    25.6157
  113.5082   22.6638    25.3213
  113.5213   22.6638    25.3635
  113.5355   22.6641    25.9853
Step 2 - Write the synthetic CSV inputs#
The production command consumes CSV files, so we follow the exact same workflow in the lesson.
tmp_dir = Path(
    tempfile.mkdtemp(prefix="gp_sg_add_zsurf_")
)
input_dir = tmp_dir / "inputs"
output_dir = tmp_dir / "enriched"
input_dir.mkdir(parents=True, exist_ok=True)
output_dir.mkdir(parents=True, exist_ok=True)

ns_main_csv = input_dir / "nansha_main.csv"
ns_lookup_csv = input_dir / "nansha_coords_with_elevation.csv"
zh_main_csv = input_dir / "zhongshan_main.csv"
zh_lookup_csv = input_dir / "zhongshan_coords_with_elevation.csv"

ns_main.to_csv(ns_main_csv, index=False)
ns_lookup.to_csv(ns_lookup_csv, index=False)
zh_main.to_csv(zh_main_csv, index=False)
zh_lookup.to_csv(zh_lookup_csv, index=False)

print("")
print("Input files")
for p in [
    ns_main_csv,
    ns_lookup_csv,
    zh_main_csv,
    zh_lookup_csv,
]:
    print(" -", p.name)
Input files
 - nansha_main.csv
 - nansha_coords_with_elevation.csv
 - zhongshan_main.csv
 - zhongshan_coords_with_elevation.csv
Step 3 - Run the real add-zsurf builder#
We use the explicit CITY=PATH form because it is the clearest
pattern for a documentation lesson.
Important options shown here#
--round-decimals 4Makes the perturbed main coordinates line up with the lookup.
--reducer meanResolves duplicated lookup coordinates by averaging elevation.
--depth-col GWL_depth_bgsLets the command compute
head_m = z_surf - GWL_depth_bgs.--summary-jsonWrites a compact cross-city merge report.
summary_json = tmp_dir / "zsurf_summary.json"

build_add_zsurf_main(
    [
        "--city",
        "Nansha",
        "--city",
        "Zhongshan",
        "--main-csv",
        f"Nansha={ns_main_csv}",
        "--main-csv",
        f"Zhongshan={zh_main_csv}",
        "--elev-csv",
        f"Nansha={ns_lookup_csv}",
        "--elev-csv",
        f"Zhongshan={zh_lookup_csv}",
        "--outdir",
        str(output_dir),
        "--out-suffix",
        ".with_zsurf.csv",
        "--summary-json",
        str(summary_json),
        "--round-decimals",
        "4",
        "--reducer",
        "mean",
        "--depth-col",
        "GWL_depth_bgs",
        "--head-col",
        "head_m",
    ]
)
[Nansha] rows: 180
[Nansha] missing z_surf: 70 (38.89%)
[Nansha] computed head_m from GWL_depth_bgs
[Nansha] saved: /tmp/gp_sg_add_zsurf_ty5ofdbw/enriched/nansha_main.with_zsurf.csv
[Zhongshan] rows: 165
[Zhongshan] missing z_surf: 53 (32.12%)
[Zhongshan] computed head_m from GWL_depth_bgs
[Zhongshan] saved: /tmp/gp_sg_add_zsurf_ty5ofdbw/enriched/zhongshan_main.with_zsurf.csv
[OK] wrote summary: /tmp/gp_sg_add_zsurf_ty5ofdbw/zsurf_summary.json
[OK] completed z_surf enrichment for:
  - /tmp/gp_sg_add_zsurf_ty5ofdbw/enriched/nansha_main.with_zsurf.csv
  - /tmp/gp_sg_add_zsurf_ty5ofdbw/enriched/zhongshan_main.with_zsurf.csv
Step 4 - Inspect the produced artifacts#
The command writes one enriched CSV per city and one optional JSON summary for diagnostics.
written = sorted(output_dir.glob("*.csv"))

print("")
print("Written files")
for p in written:
    print(" -", p.name)
print(" -", summary_json.name)

ns_out = output_dir / "nansha_main.with_zsurf.csv"
zh_out = output_dir / "zhongshan_main.with_zsurf.csv"

ns_enriched = pd.read_csv(ns_out)
zh_enriched = pd.read_csv(zh_out)
summary = json.loads(summary_json.read_text(encoding="utf-8"))
summary_df = pd.DataFrame(summary)

print("")
print("Nansha enriched preview")
print(
    ns_enriched[
        [
            "sample_idx",
            "longitude",
            "latitude",
            "GWL_depth_bgs",
            "z_surf",
            "head_m",
        ]
    ]
    .head(8)
    .to_string(index=False)
)

print("")
print("Cross-city merge diagnostics")
print(summary_df.to_string(index=False))
Written files
 - nansha_main.with_zsurf.csv
 - zhongshan_main.with_zsurf.csv
 - zsurf_summary.json

Nansha enriched preview
 sample_idx  longitude  latitude  GWL_depth_bgs  z_surf  head_m
          0   113.6165   22.7201         4.5747     NaN     NaN
          1   113.5623   22.6865         4.3151     NaN     NaN
          2   113.4675   22.7642         4.1043     NaN     NaN
          3   113.5344   22.6863         3.9002     NaN     NaN
          4   113.4811   22.7856         3.8049     NaN     NaN
          5   113.6713   22.7310         3.8367     NaN     NaN
          6   113.5213   22.6757         4.0134     NaN     NaN
          7   113.4671   22.7858         4.1917     NaN     NaN

Cross-city merge diagnostics
     city                                                main_csv                                                                 elev_csv  rows  missing_zsurf  missing_rate  computed_head     depth_col  round_decimals reducer                                                           output_csv
   Nansha    /tmp/gp_sg_add_zsurf_ty5ofdbw/inputs/nansha_main.csv    /tmp/gp_sg_add_zsurf_ty5ofdbw/inputs/nansha_coords_with_elevation.csv   180             70        0.3889           True GWL_depth_bgs               4    mean    /tmp/gp_sg_add_zsurf_ty5ofdbw/enriched/nansha_main.with_zsurf.csv
Zhongshan /tmp/gp_sg_add_zsurf_ty5ofdbw/inputs/zhongshan_main.csv /tmp/gp_sg_add_zsurf_ty5ofdbw/inputs/zhongshan_coords_with_elevation.csv   165             53        0.3212           True GWL_depth_bgs               4    mean /tmp/gp_sg_add_zsurf_ty5ofdbw/enriched/zhongshan_main.with_zsurf.csv
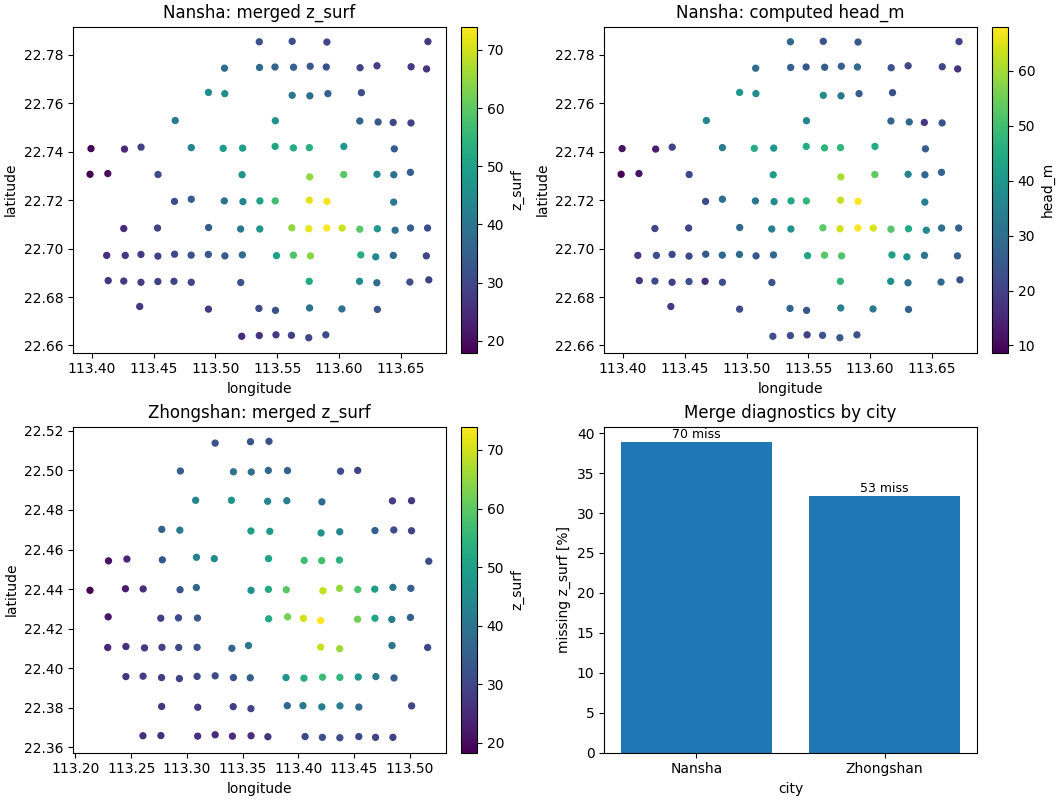
Step 5 - Build one compact visual preview#
The production command writes tabular outputs, not figures. For the gallery page, we render one compact preview so the user can immediately see what the enrichment achieved.
- Top row:
Nansha after enrichment, colored by
z_surfandhead_m.- Bottom row:
Zhongshan after enrichment, colored by
z_surfand a city-level missing-rate bar chart from the summary JSON.
fig, axes = plt.subplots(
    2,
    2,
    figsize=(10.6, 8.0),
    constrained_layout=True,
)

# Nansha z_surf
ax = axes[0, 0]
sub = ns_enriched.copy()
im = ax.scatter(
    sub["longitude"],
    sub["latitude"],
    c=sub["z_surf"],
    s=18,
)
ax.set_title("Nansha: merged z_surf")
ax.set_xlabel("longitude")
ax.set_ylabel("latitude")
cb = fig.colorbar(im, ax=ax, fraction=0.046, pad=0.04)
cb.set_label("z_surf")

# Nansha head
ax = axes[0, 1]
sub_h = sub.dropna(subset=["head_m"])
im = ax.scatter(
    sub_h["longitude"],
    sub_h["latitude"],
    c=sub_h["head_m"],
    s=18,
)
ax.set_title("Nansha: computed head_m")
ax.set_xlabel("longitude")
ax.set_ylabel("latitude")
cb = fig.colorbar(im, ax=ax, fraction=0.046, pad=0.04)
cb.set_label("head_m")

# Zhongshan z_surf
ax = axes[1, 0]
sub = zh_enriched.copy()
im = ax.scatter(
    sub["longitude"],
    sub["latitude"],
    c=sub["z_surf"],
    s=18,
)
ax.set_title("Zhongshan: merged z_surf")
ax.set_xlabel("longitude")
ax.set_ylabel("latitude")
cb = fig.colorbar(im, ax=ax, fraction=0.046, pad=0.04)
cb.set_label("z_surf")

# Missing-rate summary
ax = axes[1, 1]
ax.bar(
    summary_df["city"],
    100.0 * summary_df["missing_rate"],
)
ax.set_title("Merge diagnostics by city")
ax.set_ylabel("missing z_surf [%]")
ax.set_xlabel("city")
for i, row in summary_df.reset_index(drop=True).iterrows():
    ax.text(
        i,
        100.0 * float(row["missing_rate"]) + 0.15,
        f"{int(row['missing_zsurf'])} miss",
        ha="center",
        va="bottom",
        fontsize=9,
    )
Learn how to read the enriched CSV#
The output CSV keeps the original main-table columns and adds new information.
A good reading order is:
confirm that the original coordinates and core fields are still present;
inspect
z_surfto verify that the coordinate merge worked;inspect
head_monly when a depth-below-ground-surface column was available;check the rows with missing
z_surfbecause they tell you where the lookup table did not cover the main dataset.
Learn what the summary JSON tells you#
The optional JSON summary is especially useful for batch processing. For each city it records:
the input files used,
the number of rows processed,
how many rows ended with missing
z_surf,whether
head_mwas computed,the chosen rounding precision,
and the reducer used for duplicate lookup coordinates.
That makes it a compact QA report for the merge step.
Why coordinate rounding matters#
In real workflows, main-table coordinates and lookup coordinates are often nearly identical but not perfectly equal because of formatting, export precision, or minor preprocessing differences.
The command therefore rounds both tables before merging.
In this lesson we intentionally perturbed the main coordinates by a
tiny amount so that the role of --round-decimals is visible.
Why the reducer matters#
Elevation lookup tables can contain duplicate coordinate rows. When that happens, the command first reduces the duplicates at each rounded coordinate before merging.
The available reducers are:
meanmedianfirst
In the lesson we used mean because the synthetic lookup table was
built with small elevation duplicates on purpose.
Command-line version#
The same workflow can be reproduced from the terminal.
Family-specific command:
geoprior-build add-zsurf-from-coords \
  --city Nansha \
  --city Zhongshan \
  --main-csv Nansha=inputs/nansha_main.csv \
  --main-csv Zhongshan=inputs/zhongshan_main.csv \
  --elev-csv Nansha=inputs/nansha_coords_with_elevation.csv \
  --elev-csv Zhongshan=inputs/zhongshan_coords_with_elevation.csv \
  --outdir outputs/zsurf \
  --summary-json outputs/zsurf_summary.json \
  --round-decimals 4 \
  --reducer mean \
  --depth-col GWL_depth_bgs
Root dispatcher:
geoprior build add-zsurf-from-coords \
  --city Nansha \
  --city Zhongshan \
  --main-csv Nansha=inputs/nansha_main.csv \
  --main-csv Zhongshan=inputs/zhongshan_main.csv \
  --elev-csv Nansha=inputs/nansha_coords_with_elevation.csv \
  --elev-csv Zhongshan=inputs/zhongshan_coords_with_elevation.csv \
  --outdir outputs/zsurf \
  --summary-json outputs/zsurf_summary.json \
  --round-decimals 4 \
  --reducer mean \
  --depth-col GWL_depth_bgs
If your files already follow a regular city-based layout, you can
also use --data-root + --coords-root together with
--main-pattern and --elev-pattern instead of repeated
CITY=PATH items.
Total running time of the script: (0 minutes 0.665 seconds)